Agentic commerce requires a new measurement framework because traditional e-commerce metrics — sessions, bounce rates, click-through rates — assume a human is browsing. The five core KPIs for agent-driven commerce are: agent session rate, recommendation rate by AI platform, add-to-cart conversion from agent sessions, agent-initiated revenue attribution, and protocol error rate.
This guide explains each metric, how to track it, and what benchmarks to target based on early implementation data.
Why Traditional E-commerce Metrics Fall Short
Traditional e-commerce analytics assumes humans are browsing:
- Pageviews — Agents don’t view pages, they call APIs
- Time on site — A 200ms API call vs. a 5-minute browsing session
- Bounce rate — There’s no “bouncing” from an API endpoint
- Cart abandonment — Session expiration ≠ abandonment intent
We need metrics designed for programmatic commerce.
The Agentic Commerce Metrics Stack
Layer 1: Discovery Metrics
These measure whether agents can find your products.
Manifest Health Score
- Is your UCP manifest accessible?
- Does it validate against the spec?
- How often is it requested?
manifest_health = (successful_requests / total_requests) × schema_compliance_scoreDiscovery Request Volume
- Total discovery API calls per period
- Unique agents calling discovery
- Product categories being queried
Catalog Coverage
- % of catalog exposed via UCP
- % of SKUs with complete attributes
- Attribute completeness by category
Layer 2: Recommendation Metrics
These measure whether agents are selecting your products.
Recommendation Rate
- How often are your products recommended when relevant queries occur?
- This is hard to measure directly—you typically infer from checkout session creation
Query-to-Session Conversion
- For discovery queries that match your products, how many result in checkout sessions?
query_to_session = checkout_sessions_created / relevant_discovery_queriesCompetitive Win Rate
- When shoppers ask for products you carry, do they end up at your store or a competitor?
- Measure through market research and shopper surveys
Layer 3: Transaction Metrics
These measure checkout performance.
Session Creation Rate
- Checkout sessions created per day/week
- Growth rate over time
- Sessions by agent source (Google, Perplexity, etc.)
Session Completion Rate
- Sessions that reach payment / sessions created
completion_rate = completed_sessions / created_sessionsSession Abandonment Analysis
- Where do sessions drop off?
- Address entry, shipping selection, payment?
- Error codes causing abandonment
Average Order Value (Agent)
- AOV for agent-initiated orders vs. traditional
- Product mix differences
Layer 4: Revenue Metrics
These measure business impact.
Agent-Attributed Revenue
- Total revenue from agent-initiated checkouts
- % of total revenue from agent channel
Agent Revenue Growth Rate
- MoM and YoY growth of agent revenue
- Compare to overall e-commerce growth
Customer Acquisition Cost (Agent)
- Cost to acquire a customer through agent channel
- Should be lower than paid acquisition
Agent Customer Lifetime Value
- Do agent-acquired customers have higher or lower LTV?
- Track repeat purchases by acquisition channel
Building Your Measurement Framework
Step 1: Instrument Your UCP Layer
Add logging to every UCP endpoint:
// Example logging structure{ timestamp: "2026-01-02T10:30:00Z", event_type: "ucp_checkout_session_created", session_id: "cs_abc123", agent_identifier: "google-shopping-agent/1.0", ip_address: "hashed_or_anonymized", items: [ { product_id: "SKU-123", quantity: 1 } ], locale: "en-US", currency: "USD"}Step 2: Track Session State Changes
Every state transition should be logged:
{ timestamp: "2026-01-02T10:32:00Z", event_type: "ucp_session_state_change", session_id: "cs_abc123", previous_state: "created", new_state: "address_set", duration_in_previous_state_ms: 120000}Step 3: Connect to Your Analytics Stack
Feed UCP events into your existing analytics:
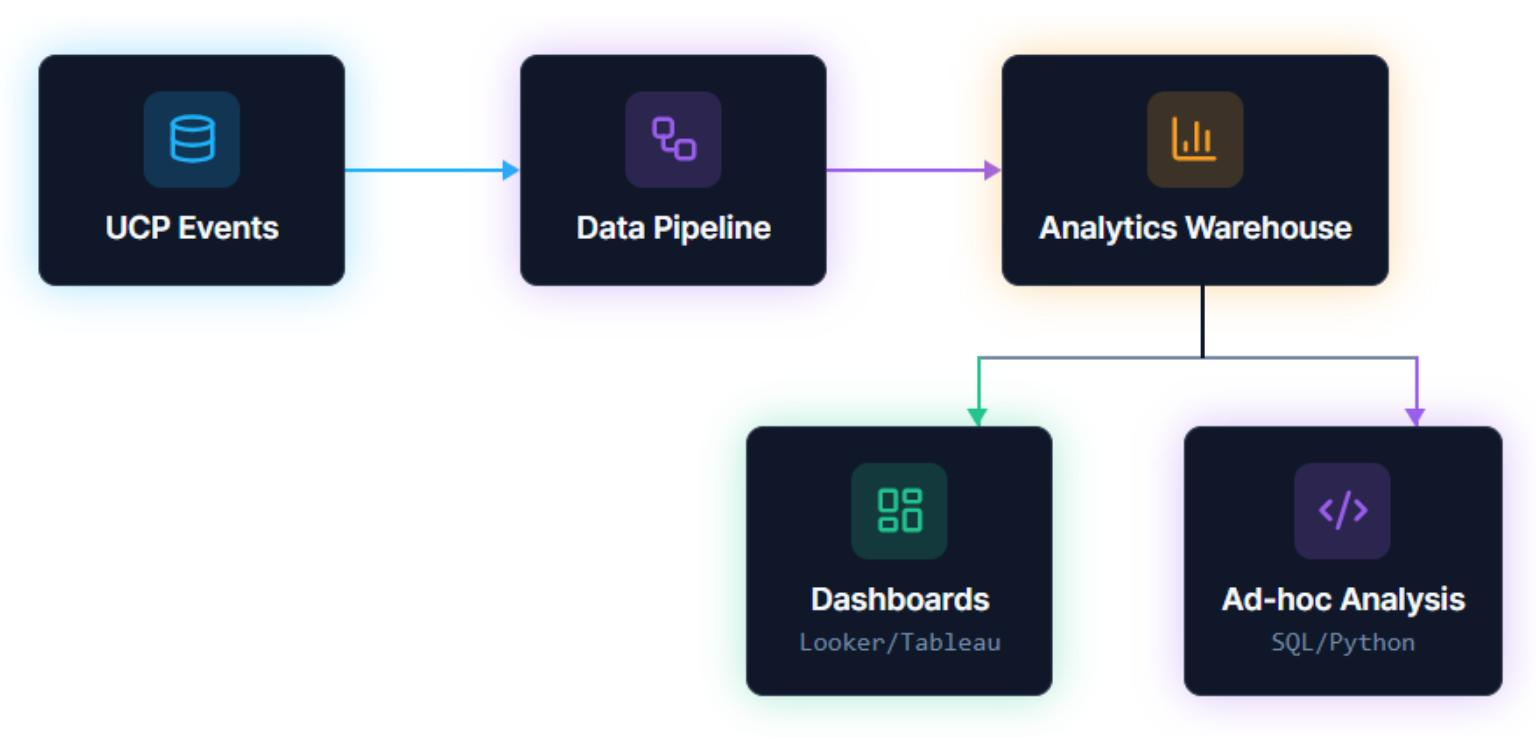
Step 4: Build Dashboards
Executive Dashboard
- Agent revenue (absolute and % of total)
- Week-over-week growth
- Session completion rate
- Top products by agent sales
Operations Dashboard
- Session creation by hour/day
- Error rates by type
- Average session duration
- Geographic distribution
Product Dashboard
- Products most recommended by agents
- Products with high discovery but low conversion
- Attribute completeness scores
- Price competitiveness signals
Metrics to Watch Early
When you’re just getting started, focus on:
1. Is Anyone Knocking?
Before worrying about conversion, confirm agents are finding you:
- Discovery endpoint request volume
- Unique agent user-agents
- Geographic distribution of requests
2. Are Sessions Starting?
- Session creation events
- Session creation by agent source
- Errors during session creation
3. Where Do Sessions Break?
Map the funnel:
Session Created: 1000Address Set: 800 (80%)Shipping Selected: 750 (75%)Payment Started: 600 (60%)Payment Completed: 500 (50%)Identify your biggest drop-off and fix it first.
Benchmarks (Early Estimates)
| Metric | Early Adopter | Mature Implementation |
|---|---|---|
| Session Completion Rate | 30-40% | 50-70% |
| Agent AOV vs. Traditional | 0.8-1.0x | 1.2-1.5x |
| Agent % of Revenue | 0.1-1% | 5-15% (projected) |
| Agent CAC vs. Paid | 0.3-0.5x | 0.1-0.3x |
Common Measurement Mistakes
1. Treating Agent Traffic Like Human Traffic
Don’t pour agent events into your standard web analytics. They’ll pollute human behavior metrics and create confusing dashboards.
Solution: Separate data streams from the start.
2. Obsessing Over Session Volume
Early on, session volume is vanity. A hundred sessions that don’t convert teach you nothing.
Solution: Focus on completion rate first, volume second.
3. Ignoring Error Analysis
When sessions fail, you get error codes. Those codes are a goldmine.
Solution: Log every error, categorize by type, fix systematically.
4. Not Tracking by Agent
Different agents may have different behaviors. Google’s agent might convert well; another might send garbage traffic.
Solution: Segment all metrics by agent identifier.
Setting Targets
For your first 90 days:
- Month 1: Establish baselines — instrument everything; no optimization, just measurement; document current state.
- Month 2: Identify opportunities — where are the biggest drop-offs? Which products get discovered but not purchased? What errors occur most frequently?
- Month 3: Targeted improvements — fix the top 3 issues identified, measure impact, set ongoing targets.
Need help building your measurement framework? Our agentic commerce strategy service includes measurement setup and optimization. Get in touch.